Physical & Chemical Inspection of Pickling Corrosion of SS304L Flanges
The stainless steel flange and stainless steel pipe produced by a company need to be pickled after welding. After pickling, it was found that thinning occurred due to corrosion for one of the flanges in the welding seam and its surrounding areas. The flange is made of stainless steel 304L. The production processes of this flange are round bar blanking, forging, turning, solid solution treatment, flange and pipe welding, and pickling passivation. The electrode selected for welding is E308L-16, and the welding method is manual arc welding. In order to find out the cause of corrosion of the flange, a failure analysis was carried out on the pickling corrosion of the flange after welding.
1. Macroscopic morphology analysis
Figure 1 is a macro morphological photo of corrosion of the flange. It can be seen from the figure that the welding seam between the flange and pipe and the surrounding area were corroded, and corroded grooves in some areas extended to the flange's bolt holes. Corrosion appeared as a fresh rough surface, similar to a sandblasted surface. Except for the corrosion area, other surfaces were treated with normal pickling passivation, and no corrosion was found. Therefore, it can be preliminarily judged that the corrosion of the flange may be related to welding.
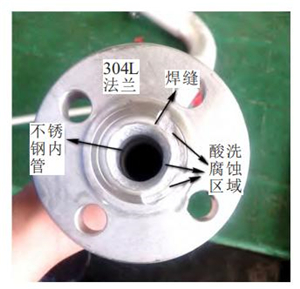
Figure 1 The macromorphology of corrosion of the flange
2. SEM analyses of the flange's surface
The corrosion part of the flange was sampled for SEM analysis, as shown in Figure 2. In the figure, it can be seen that the surface of the corroded flange showed a typical crystal, which was due to the aggregation of carbides at the grain boundary, resulting in a lack of chromium at the grain boundary. They were corroded by acidic media and then fell off. The surface of the uncorroded area showed a normal pickling passivation surface.
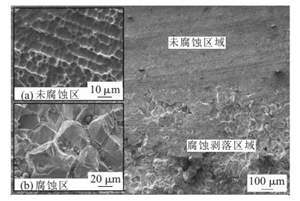
Figure 2 SEM images of the corroded and uncorroded flanges
3. The analysis of the chemical composition
Chip samples were taken from the flange's base metal, welding seam area and corrosion area, and the chemical composition was analyzed by ICP inductive coupled atomic emission spectrometers and carbon-sulfur analyzers. The sample positions were showed in figure 3. It can be seen from Table 1 that the composition of the base metal meets the requirements of the composition of stainless steel 304L (022Cr19Ni10) in GB/T20878-2007. 304L is an ultra-low carbon austenitic stainless steel. In addition to the excellent properties of stainless steel 304, it also has excellent resistance to intergranular corrosion. Generally, no solution treatment is required after welding, and 304L is suitable for manufacturing corrosion-resistant equipment and components that cannot be post solution treated. The carbon content of the welding seam is 0.18%, which is much higher than the requirements of the welding wire and base metal. The carbon content of corrosion zone 1 and corrosion zone 2 is 0.15% and 0.11%, which are much higher than the requirement for the carbon content for 304L. The carbon content in the welding seam and corrosion zone is too high, and it is easy to cause carbides to aggregate at the grain boundary in the welding process, resulting in a lack of intergranular chromium and intergranular corrosion.
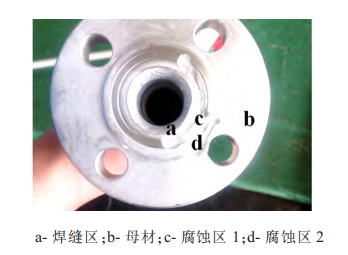
Figure 3 Locations of chemical composition analyses
Table 1 Chemical composition analysis results of the stainless steel flange (wt% )
1. Macroscopic morphology analysis
Figure 1 is a macro morphological photo of corrosion of the flange. It can be seen from the figure that the welding seam between the flange and pipe and the surrounding area were corroded, and corroded grooves in some areas extended to the flange's bolt holes. Corrosion appeared as a fresh rough surface, similar to a sandblasted surface. Except for the corrosion area, other surfaces were treated with normal pickling passivation, and no corrosion was found. Therefore, it can be preliminarily judged that the corrosion of the flange may be related to welding.
Figure 1 The macromorphology of corrosion of the flange
2. SEM analyses of the flange's surface
The corrosion part of the flange was sampled for SEM analysis, as shown in Figure 2. In the figure, it can be seen that the surface of the corroded flange showed a typical crystal, which was due to the aggregation of carbides at the grain boundary, resulting in a lack of chromium at the grain boundary. They were corroded by acidic media and then fell off. The surface of the uncorroded area showed a normal pickling passivation surface.
Figure 2 SEM images of the corroded and uncorroded flanges
3. The analysis of the chemical composition
Chip samples were taken from the flange's base metal, welding seam area and corrosion area, and the chemical composition was analyzed by ICP inductive coupled atomic emission spectrometers and carbon-sulfur analyzers. The sample positions were showed in figure 3. It can be seen from Table 1 that the composition of the base metal meets the requirements of the composition of stainless steel 304L (022Cr19Ni10) in GB/T20878-2007. 304L is an ultra-low carbon austenitic stainless steel. In addition to the excellent properties of stainless steel 304, it also has excellent resistance to intergranular corrosion. Generally, no solution treatment is required after welding, and 304L is suitable for manufacturing corrosion-resistant equipment and components that cannot be post solution treated. The carbon content of the welding seam is 0.18%, which is much higher than the requirements of the welding wire and base metal. The carbon content of corrosion zone 1 and corrosion zone 2 is 0.15% and 0.11%, which are much higher than the requirement for the carbon content for 304L. The carbon content in the welding seam and corrosion zone is too high, and it is easy to cause carbides to aggregate at the grain boundary in the welding process, resulting in a lack of intergranular chromium and intergranular corrosion.
Figure 3 Locations of chemical composition analyses
Table 1 Chemical composition analysis results of the stainless steel flange (wt% )
| Element | C | Cr | Ni | Si | S | P | Mn | Mo | Cu |
| Welding seam areas | 0.18 |
18.50 |
8.59 |
0.32 |
0.018 |
0.024 |
1.50 |
0.32 |
0.24 |
| Base metal | 0.023 | 18.09 | 8.05 | 0.461 | 0.008 | 0.038 | 1.23 | - | - |
| Corrosion Zone 1 | 0.15 |
18.24 |
8.35 |
0.30 |
0.015 |
0.033 |
1.28 | - | - |
| Corrosion Zone 2 | 0.11 |
18.11 |
8.16 |
0.33 |
0.014 |
0.031 |
1.27 |
- |
- |
| 304L base metal | Less than and equal to 0.03 | 18.0 to 20.0 | 8.00 to 12.00 | Less than and equal to 1.0 | Less than and equal to 0.030 | Less than and equal to 0.045 | Less than and equal to 2.00 | - |
- |
| E308L-16 electrodes | Less than and equal to 0.04 | 18.0 to 21.0 | 9.00 to 12.00 | Less than and equal to 1.0 | Less than and equal to 0.03 | Less than and equal to 0.04 | 0.5 to 2.5 | Less than and equal to 0.75 | Less than and equal to 0.75 |
4. Metallographic Analyses
In order to find out the cause of the corrosion, samples were taken from the uncorroded and corroded parts of the flange, and the non-metallic inclusions and microstructure comparison tests were carried out. The analysis of non-metallic inclusions showed that there were no other obvious inclusions except a small number of oxide inclusions in the uncorroded part, and the rating result was D0.5. There were a lot of inclusions in the corrosion of the flange area, as shown in Figure 4, the rating results were A1.0, B2.5s and D0.5. The existence of a large number of inclusions indicated that the metallurgical quality of the area or the flange was poor, which would affect the corrosion resistance of the metal, pitting corrosion would happen especially. However, uniform corrosion and thinning in a large area of the material would not happen. Not many inclusions were found in the other samples of corroded areas, so the flange's failure caused by corrosion was not related to the inclusions.
The microstructures of the uncorroded and corroded flanges are shown in Figure 5. The microstructure of the uncorroded area was mainly twinned crystal austenite structure plus a small amount of strip ferrite structure. The structure of the corroded area was twinned crystal austenite structure plus a small amount of strip ferrite structure, but there were carbides in the grain boundaries, which would affect the intergranular corrosion resistance of austenitic stainless steel. The grain size of this flange is rated as 6.5 according to the GB/T6394 standard, and the grain size is normal.
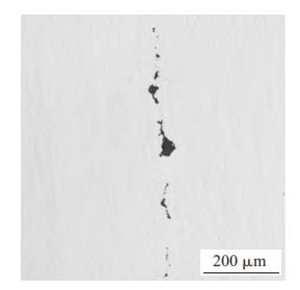
Figure 4 Micrographs of non-metallic inclusions at the corrosion part
5. Intergranular corrosion tests
Since the flange was welded, the structure of the corroded area showed sensitization in the crystal boundary. Therefore, intergranular corrosion method test A was used for the corroded samples and uncorroded samples to determine whether there was sensitization in the crystal boundary according to GB/T4334-2008 Corrosion of Metals and Alloys: Test Methods for Intergranular Corrosion of Stainless Steel.
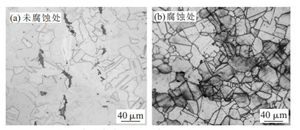
Figure 5 Microstructures of uncorroded and corroded flanges
Figure 6 is a macro photo of the sample taken at the corroded part after the intergranular corrosion test A. It can be seen from the figure that the cross-section of the sample could be divided into three different regions according to the degree of corrosion, namely, the seriously sensitized region, the sensitized region and the unsensitized region. The high magnification metallographic photos of each area are shown in Figure 7. The unsensitized area had a stepped structure, and both the sensitized area and the seriously sensitized area had groove structure; the corrosion of the seriously sensitized area was more serious.

Related News
- Analysis of Loading-Port Flange Leakage in a Reactor Coolant Purification Resin Bed of a Power Plant
- Structural Design and Strength Analysis of a Deepwater Riser Suspension Flange
- Analysis of Heat Dissipation Losses in High-Temperature Flanges and Pipelines Used in Oil Refineries
- Failure and Crack Analysis of an EO/EG Unit Tower Inlet Flange
- Pipe Flange Bolt Tightening in LNG Projects: Key Considerations
- Ultrasonic Testing of High-Neck Flange Welds
- Underwater Flange Connection Methods for Submarine Pipelines
- Key Technologies for Pressure Vessel Testing and Flange Connection Design
- Installation of Main Bolts for Lap Joint Flange in High-Temperature Gas-Cooled Reactors
- Structural Design and Finite Element Analysis of Anchor Flanges