Ultrasonic Testing of High-Neck Flange Welds
High-neck flanges used in enameled reactors are typically made from hot-rolled steel sections that are bent, welded, heat-formed, annealed, and finally machined. The steel grade used is 10 steel, and 422 welding rods are employed. To ensure weld quality, all high-neck flange welds must undergo 100% ultrasonic testing. The cross-section has an inverted I-shaped weld with a 50° groove angle. Side A is machined from top to bottom, while Side B is machined from the inside outward, as shown in Figure 2. Cross-layer welding is used. The quality of high-neck flange welds must satisfy both structural strength requirements and the specific demands of the enameling process. Weld grain size should be as fine as possible, with no large or deep pores on or near the enameled surface.
Choosing a Flaw Detection Technology
The single-angle shear wave probe method is preferred for detecting flaws in high-neck flange joint welds, as these welds often contain vertical defects along the fusion line. In this method, the acoustic beam is perpendicular to the defect, which facilitates detection. By contrast, using a straight probe with longitudinal wave incidence can easily overlook defects. Moreover, the angled probe method eliminates blind spots on the workpiece, ensuring that defects near the weld surface are reliably detected.
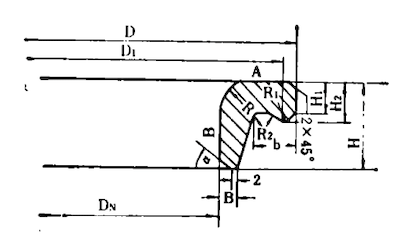
Figure 1. High-Neck Flange Shape and Dimensions
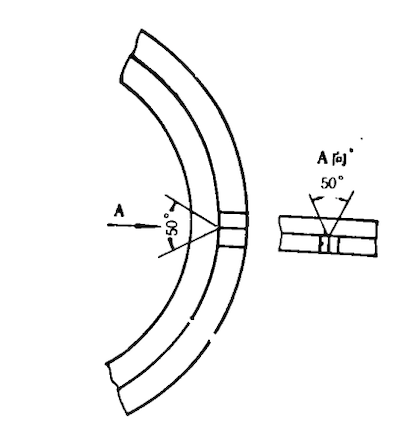
Figure 2. Joint Weld Cross-Section
Because the joint weld has an inverted L-shaped configuration, the probe must be placed on surfaces A and B for inspection (Figure 1). These surfaces are selected for their relative flatness, which facilitates defect detection and accurate positioning.
The depth-location method is preferred. The point at which the defect echo appears on the time-scan line of the fluorescent screen represents the vertical projection depth of the defect from the probe’s point of incidence. The horizontal distance from the probe’s point of incidence can be calculated by multiplying the depth by the K-value. Additionally, after machining the high-neck flange, the weld metal structure becomes coarse and bright, making it easily distinguishable from the base metal. Therefore, by observing the probe’s position on or near the joint weld and combining it with the calculated horizontal distance, the defect’s horizontal location can be determined quickly.
Single-wave flaw detection has two main advantages:
After fine machining of the high-neck flange ring, no excess weld height remains. During single-wave flaw detection, probe movement in the forward or backward direction does not affect the results. The thickness of the high-neck flange ring is uneven in the A and B directions, and the back surface is sloped. Using double- or triple-wave flaw detection makes defect location very difficult and often inaccurate. However, single-wave flaw detection places higher demands on both the instrument and the probe. When the probe and instrument are properly matched, noise near the second harmonic (yellow-light decomposition wave) is minimized.
The weld of the high-neck flange ring joint is made using multi-layer manual arc welding, which increases the likelihood of unfused defects. Because the joint cut angle is 50° (25° on each side), the incident beam should be perpendicular—or nearly perpendicular—to the cut surface. Therefore, the K-value should be set between 2.1 and 2.4, corresponding to a refraction angle of 63.5°–67.5°. Under these conditions, unfused defects can be detected most easily.
When the probe is positioned on Side B, it rests on the concave inner-diameter surface of the high-neck flange ring. Its effects on flaw detection are summarized as follows:
(1) Impact on Probe Coupling
The primary concern is the maximum gap between the concave inner-diameter arc surface and the probe contact surface, and its effect on flaw detection. Refer to Figure 3 and Equation (1):

Where:
EB = 1/2 probe length

Assuming a probe length of 30 mm and inner diameters of φ900, φ1300, and φ1760, the gaps between the inner-diameter arc surface and the probe contact surface are 0.25 mm, 0.17 mm, and 0.18 mm, respectively—values that are considered negligible. Additionally, when using an angled probe wedge, the probe tip tends to wear more quickly at the ends and more slowly at the center. To compensate, the wedge is ground into a convex arc shape, enabling it to conform more closely to the concave inner surface of the flange ring. With an oil coupling layer between the two surfaces, flaw detection is essentially unaffected.
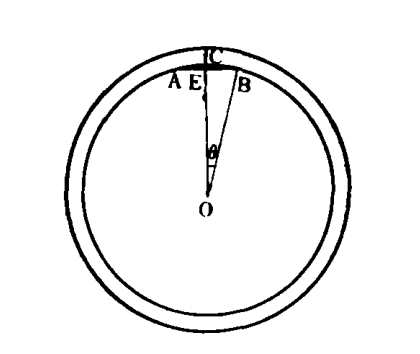
Figure 3 Schematic Diagram of Coupling Effects
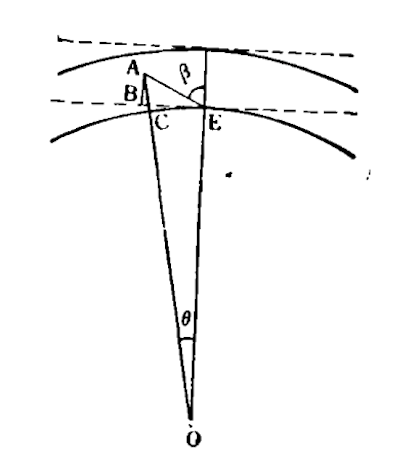
Figure 4 Schematic Diagram of Defect Location Error
(2) Impact on Defect Location
In ultrasonic testing of flat-plate butt welds, defect location is determined by the depth, D, and span coordinates (AB and BE in Figure 4):
L=KD (2)
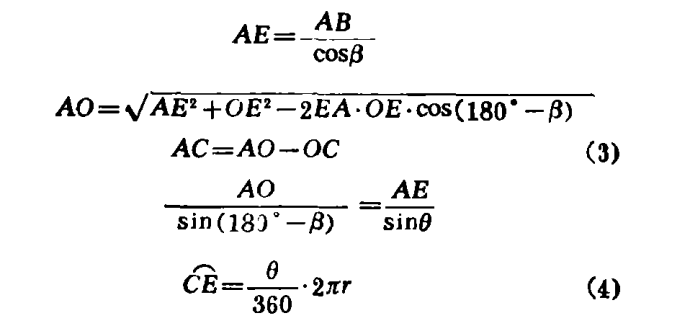
For circumferential flaw detection on the concave inner surface of a high-neck flange ring, defect location is determined by the depth, h, and the arc-length coordinates (AC and CE). In practice, the defect position can be determined using the depth-location method on the time-scan line, converting flat-plate coordinates (D, L) into arc-surface coordinates (h, L′) according to Equations (3) and (4). Assuming a probe wedge refraction angle of β = 65° and an inner diameter of φ1000, when the defect depths displayed on the fluorescent screen are 2, 8, 15, 20, and 28 mm, the corresponding (D, L) and (h, L′) values are listed in Table 2. These values can also be plotted as a correction curve. Table 2 shows that when D ≤ 15 mm, the errors between D and h, as well as between L and L′, are less than 1 mm. When D exceeds 15 mm, corrections can be made using the tabulated values.
Table 2. Conversion and Error Table for D–L and h–L′ Coordinates
|
D (AB) |
h (CACI) |
Error |
L (BE) |
L′ (CE) |
Error (L–L′) |
|
2 |
2.01 |
0.01 |
4.28 |
4.27 |
0.01 |
|
8 |
8.29 |
0.29 |
17.12 |
16.87 |
0.25 |
|
15 |
16.00 |
1.00 |
32.10 |
31.20 |
0.90 |
|
20 |
21.77 |
1.77 |
42.80 |
41.15 |
1.65 |
|
28 |
31.40 |
3.40 |
59.92 |
56.62 |
3.30 |
Thus, for depths up to 15 mm, location errors remain minimal (<1 mm). For depths beyond 15 mm, corrections should be made according to Table 2.
(3) Impact on Sensitivity
When an ultrasonic beam passes from a low-velocity medium into a concave high-velocity medium, scattering occurs; at the same time, the sound energy density increases. Comparative testing of a 2 mm horizontal flat-bottom hole located 15 mm below the surface shows that, on a concave surface with an inner diameter of φ1000, sensitivity can be up to 2 dB higher than on a flat surface.
Defects and Evaluation of High-Neck Flange Joint Welds
(1) Incomplete Penetration
This defect appears as a band along the fusion line, typically featuring a wide gap and containing black slag. In multi-layer welding, incomplete penetration can occur if slag at the fusion line is not properly cleaned. During ultrasonic testing, it generates a distinct linear indication with a high sinking wave amplitude, equivalent to φ1×6 + 15 dB or higher. Since incomplete penetration is a volumetric defect, defect echoes can be detected from both sides of the weld.
(2) Porosity
Two types of porosity are commonly observed in these welds:
Chain Porosity:
These pores form along the fusion line where gaps and entrapped air are present. The pore diameter is relatively small (φ0.5–1.5 mm) but is distributed uniformly.
The total length of the pore chain exceeds 5 mm. Ultrasonic testing produces a linear indication with amplitudes ranging from φ1×6 + 1 dB to φ1×6 + 15 dB. Defect echoes can be detected on both sides of the weld.
Dense Porosity:
These pores can occur anywhere within the joint, with diameters not exceeding φ2 mm. The distribution density varies: in some areas, the pores are closely spaced, while in others, they are more scattered. During ultrasonic inspection, multiple defect echoes appear, with amplitudes rising and falling as the probe moves. The amplitudes generally fall within Zones I and II, and defect echoes can be detected on both sides of the weld.
(3) Lack of Fusion
This defect occurs along the fusion line as a localized lack of bonding, typically presenting a very small gap and rarely containing slag inclusions. The primary causes include excessive electrode travel speed during manual arc welding, insufficient heat input, incomplete melting of the base metal, and inadequate metallurgical bonding between the weld and base metals. Ultrasonic testing of lack of fusion is highly directional: the maximum amplitude occurs only when the sound beam is nearly perpendicular to the lack-of-fusion surface. At this angle, receiver sensitivity is very high, but no echo is observed on the opposite side. The amplitude of the echo depends on the size of the unfused surface and generally falls within Zone I.
(4) Slag Inclusions
Slag inclusions can occur anywhere within a joint weld. They may appear as round particles resembling soybeans, mung beans, or sesame seeds, or as small honeycomb-like clusters. Their colors vary—black, brown, yellow, or white—and they are typically loose, often containing entrapped gas. The primary cause is improper manual arc welding practices, particularly inadequate slag removal between passes. During ultrasonic testing, the echo amplitude depends on the size and shape of the inclusion. For inclusions within Zone I—particularly large or elongated (bar-shaped) ones—the amplitude generally remains within Zone I. Defect echoes can be detected on both sides of the weld; however, the amplitudes are inconsistent due to the irregular geometry of the inclusions.
(5) Coarse-Grained Welds
Improper welding procedures can result in coarse grain formation in joint welds, producing structures that resemble rocky slag. When inspected with a 5 MHz probe, coarse grains generate forest-like noise signals. Lowering the probe frequency can reduce or even eliminate these noise waves. Coarse grains may form not only within the joint weld itself but also in the heat-affected zone (HAZ) of the base metal.
Related News
- Structural Design and Strength Analysis of a Deepwater Riser Suspension Flange
- Analysis of Heat Dissipation Losses in High-Temperature Flanges and Pipelines Used in Oil Refineries
- Failure and Crack Analysis of an EO/EG Unit Tower Inlet Flange
- Pipe Flange Bolt Tightening in LNG Projects: Key Considerations
- Ultrasonic Testing of High-Neck Flange Welds
- Underwater Flange Connection Methods for Submarine Pipelines
- Key Technologies for Pressure Vessel Testing and Flange Connection Design
- Installation of Main Bolts for Lap Joint Flange in High-Temperature Gas-Cooled Reactors
- Structural Design and Finite Element Analysis of Anchor Flanges
- Key Welding Technology for High-Neck Flange and Steel Pipe Joints
