Failure Analyses of 304 Stainless-steel Flanges in Propylene
The stainless-steel flange in the pressure pipeline of a polypropylene plant of a petrochemical plant leaked during the operation of several flange necks. After repair welding, there was no leakage at the welded part in a short time, but other flanges still leak. The outer wall of the flange is painted, and the medium in the pipe is propylene. The flanges of several pipelines leaked, which directly affected the production of the entire device, causing the entire device to be shut down for maintenance. The failure causes of the cracked flange area were analyzed by sampling.
1. Introduction to working conditions
The stainless-steel flange in the pressure pipeline of the propylene device is made of 0Cr18Ni9, with a size of DN50mm, operating pressure 3.6MPa, and operating temperature 60°C. The working medium is propylene.
2. The analysis of the sample
2.1 Macro inspection
Macroscopic inspection of the leaked flange shows that there was no obvious corrosion product after the outer wall of the flange is treated with anti-corrosion. The morphology detected by PT is shown in Figure 1. There were two stepped cracks with lengths of 34mm and 12mm along the circumferential direction of the flange neck. The cracks were close to the welding seam on the flange side. The sample is shown in Figure 1.
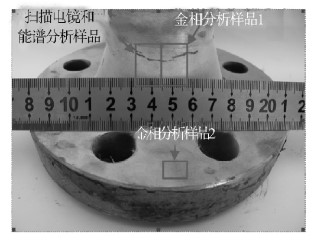
Figure 1 Morphology and sampling of PT detection
2.2 Spectral analyses
The flange material was chemically analyzed by the SPECTROLAB direct reading spectrometer, and the results are shown in Table 1. It can be seen that the chemical composition of the flange meets the requirements of NB/T 47010-2010 for 0Cr18Ni9 stainless steel.
Table 1 The chemical composition of flanges
1. Introduction to working conditions
The stainless-steel flange in the pressure pipeline of the propylene device is made of 0Cr18Ni9, with a size of DN50mm, operating pressure 3.6MPa, and operating temperature 60°C. The working medium is propylene.
2. The analysis of the sample
2.1 Macro inspection
Macroscopic inspection of the leaked flange shows that there was no obvious corrosion product after the outer wall of the flange is treated with anti-corrosion. The morphology detected by PT is shown in Figure 1. There were two stepped cracks with lengths of 34mm and 12mm along the circumferential direction of the flange neck. The cracks were close to the welding seam on the flange side. The sample is shown in Figure 1.
Figure 1 Morphology and sampling of PT detection
2.2 Spectral analyses
The flange material was chemically analyzed by the SPECTROLAB direct reading spectrometer, and the results are shown in Table 1. It can be seen that the chemical composition of the flange meets the requirements of NB/T 47010-2010 for 0Cr18Ni9 stainless steel.
Table 1 The chemical composition of flanges
| Elements | C | Si | Mn | P | S | Ni | Cr |
| Measured values | 0. 075 | 0.603 | 0.983 | 0.026 | 0.003 | 18.00 | 8. 43 |
| Standard values NB/T 47010-2010 | Less than and equal to 0. 080 | Less than and equal to 1.000 | Less than and equal to 2.000 | Less than and equal to 0.035 | Less than and equal to 0.020 | 18.00 to 20.00 | 8.00 to 10.00 |
2.3 Metallographic analyses
The crack morphology of the flange is shown in Figure 2. It can be seen that the crack extended along the grain from the outside to the inside. The crack has penetrated the entire thickness; no crack from the inside to the outside was found, and the flange's raw material had no obvious non-metallic inclusions. Figure 3a is the microstructure photo of sample 1. The microstructure is austenite, with precipitation of disperse carbides, and the material is severely sensitized. Figure 3b is the microstructure photo of sample 2; the microstructure is austenite, and the material was still severely sensitized. The position of metallographic sample 2 was far away from the welding seam, and the welding process of flange and pipe did not have an effect on the microstructure of metallographic sample 2.
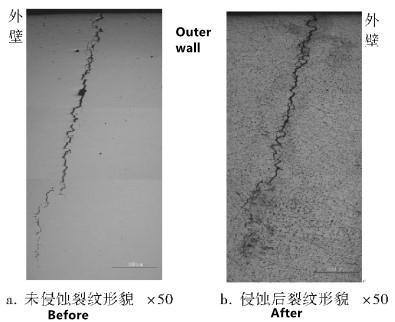
Figure 2 The morphology of the flange crack
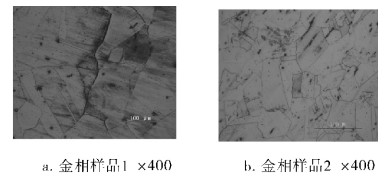
Figure 3 Radial cross-sectional structure of metallographic samples
2. 4 SEM morphology analyses
The metallographic structure of sample 1 was analyzed by scanning electron microscope. The results are shown in Figure 4. There were a large number of micro-cracks on the outer surface of the sample, and the cracks extended along the grain from the outer wall to the inner wall; in the crack propagation process, the inclusions at the grain boundaries fell off, and it can be inferred that the crack originated from a multi-source crack on the surface. After the sample was opened, a SEM analysis was carried out. The results are shown in Figure 5. The cracked area showed a crystalline morphology with secondary cracks, which was a typical intergranular cracking. There were a large number of dimples and tearing edges in the open area.
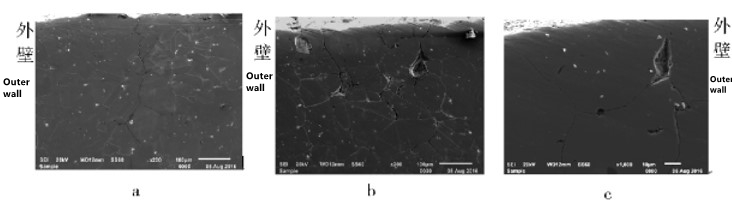
Figure 4 Scanning electron microscope morphology of metallographic sample 1
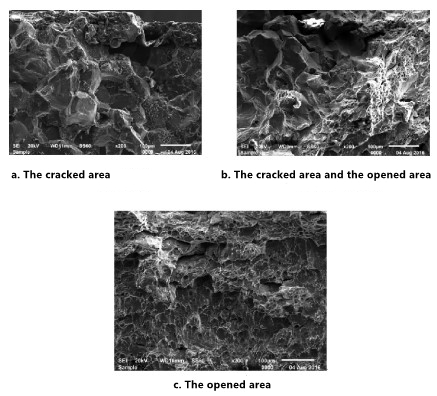
Figure 5 The fracture morphology
2.5 EDS Analyses
Energy spectrum analysis was performed on the surface of metallographic sample 1 (Table 2). The energy spectrum analysis of the opened SEM specimen (Table 3) shows that the Cl content in the cracked area is 2.14% (weight percent), and with the increase of the tearing depth, the Cl content gradually decreases; in the open area, the Cl content is 0% (weight percent), indicating that Cl- has not played a role in stress corrosion in the uncracked area of the material.
Table 2 Energy spectrum analysis results of surfaces of metallographic sample 1
| Element | Weight/% | Atom/% |
| C K | 6.67 | 14.51 |
| OK | 32.94 | 53.77 |
| Al K | 0.46 | 0.44 |
| Si K | 0.60 | 0.56 |
| S K | 0.76 | 0.62 |
| Cl K | 0.46 | 0.34 |
| Ca K | 12.25 | 7.98 |
| Cr K | 11.55 | 5.80 |
| Fe K | 31.31 | 14.64 |
| Ni K | 3.00 | 1.33 |
Table 3 Energy spectrum analysis results of Cl elements of cracks
| Crack positions | Weight/% | Atom/% |
| Cracking zones | 2.14 | 2.13 |
| Crack zones plus open zones | 0.39 | 0.48 |
| Open areas | 0.00 | 0.00 |

Related News
- Analysis of Loading-Port Flange Leakage in a Reactor Coolant Purification Resin Bed of a Power Plant
- Structural Design and Strength Analysis of a Deepwater Riser Suspension Flange
- Analysis of Heat Dissipation Losses in High-Temperature Flanges and Pipelines Used in Oil Refineries
- Failure and Crack Analysis of an EO/EG Unit Tower Inlet Flange
- Pipe Flange Bolt Tightening in LNG Projects: Key Considerations
- Ultrasonic Testing of High-Neck Flange Welds
- Underwater Flange Connection Methods for Submarine Pipelines
- Key Technologies for Pressure Vessel Testing and Flange Connection Design
- Installation of Main Bolts for Lap Joint Flange in High-Temperature Gas-Cooled Reactors
- Structural Design and Finite Element Analysis of Anchor Flanges